
Function dilations, introduced using both a visual and an algebraic approach.
Category: Concepts
Function Transformations: Translation
Function translations, introduced using both a visual and an algebraic approach.
Using Corresponding Points to Determine Dilation Factors and Translation Amounts
A worked example of how to determine transformation functions and the transformed equation, given the equation of the first graph and two sets of corresponding points from the graphs.
Pi Notation (Product Notation)

Explanation of how Pi notation describes the product of a series of factors.
Sigma Notation (Summation Notation)
Explanation of Sigma notation, also known as Summation Notation. Explanations of how to describe a sum of terms using it, with examples.
Absolute Value: Notation, Expressions, Equations

How to interpret absolute value notation and solve equations that include absolute values. Examples are linear equations, but the same approach works with non-linear equations.
Combining or Collecting Like Terms
What are “like terms” in algebra, why can they be combined, and how should they be combined? Both an intuitive and an algebraic approach are described, with examples.
Simplifying Fractions
Fractions whose numerator and denominator share a common factor can be simplified. See why this is the case, with multiple examples to demonstrate the process.
Negative Differences
Math problems often include negative differences. Familiarity with ways of manipulating them will help to both avoid common errors and recognize equivalent expressions.
Negative Fractions
Explanation of why a negative sign can be placed, or moved to, in front of a fraction, in front of its numerator, or in front of its denominator, without changing the value of the fraction.
Geometric Sequences and Geometric Series
How to recognize, create, and describe a geometric sequence (also called a geometric progression) using closed and recursive definitions. Formulas for calculating the Nth term, the sum of the first N terms, and the sum of an infinite number of terms are derived. Also describes approaches to solving problems based on Geometric Sequences and Series.
Arithmetic Sequences and Arithmetic Series
How to recognize, create, and describe an arithmetic sequence (also called an arithmetic progression) using closed and recursive definitions. Formulas for calculating the Nth term, and the sum of the first N terms are derived. Also describes approaches to solving problems based on arithmetic sequences and series.
Piecewise Functions and Relations
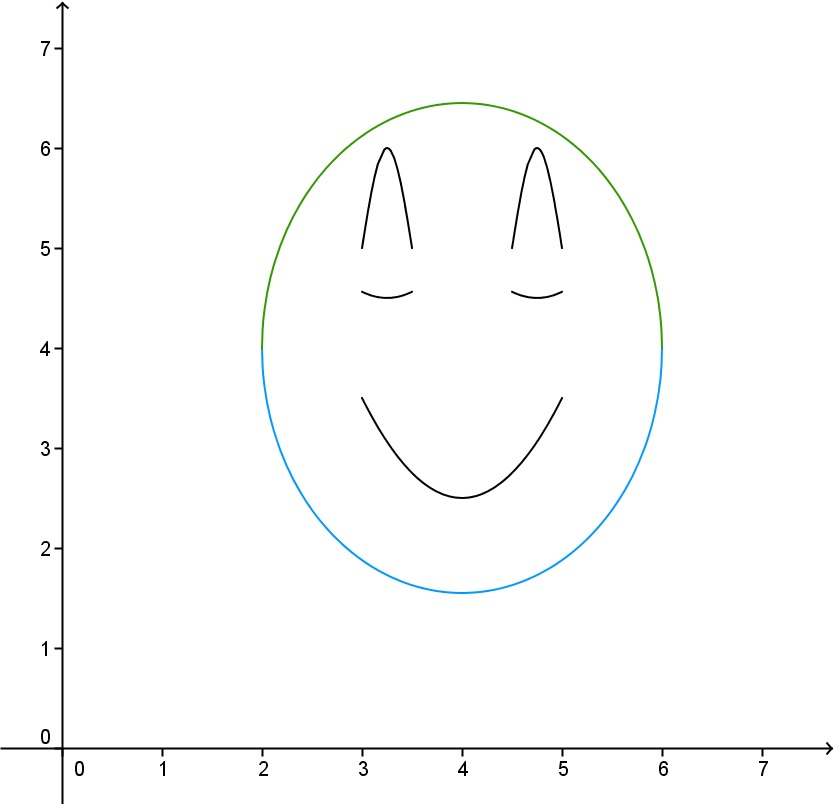
Introduction to definitions that are a combination of various functions or relations, each over a specific domain. Such definitions are called piecewise functions or relations. Shows how a piecewise definition can define a “smiley face” .
Linear Systems: Why Does Linear Combination Work (Graphically)?
A system of linear equations consists of multiple linear equations. You can think of this as multiple lines graphed on one coordinate plane. Three situations can arise when looking at such a graph. Either:1) No point(s) are shared by all lines shown2) There is one point that all lines cross through3) The lines lie on top…… Continue reading Linear Systems: Why Does Linear Combination Work (Graphically)?
Domain, Range, and Codomain of a Function
Explanation of the terms “Domain”, “Range”, and “Co-Domain” of a function. These concepts provide a critical foundation for analyzing and graphing any function.
